Bitcoin (BTC) trading sideways may be boring for those trying to profit from the price swings, but it is far from a new thing for the original cryptocurrency to do (relatively) nothing.
If there is one thing all traders need to make money, it’s volatility. And bitcoin traders are no different from traditional traders here. In fact, it could be argued that they rely on strong volatility even more due to the more volatile nature of digital assets compared to traditional assets like stocks and fiat currencies.
As a result, bitcoin’s volatility – or lack thereof – has again become a concern for some with the number one cryptocurrency now on its third week in a consolidation zone that measures less than 10% from bottom to top.
The latest round of sideways price action started on May 10th, when the BTC chart had just printed its 7th weekly red candle – then, the biggest number of weekly red candles bitcoin’s history.
As usual in markets, volatile periods end with consolidation phases, which in turn typically end with a new round of volatility. As such, it is perhaps no surprise that bitcoin has now stayed within a relatively narrow range for some time.
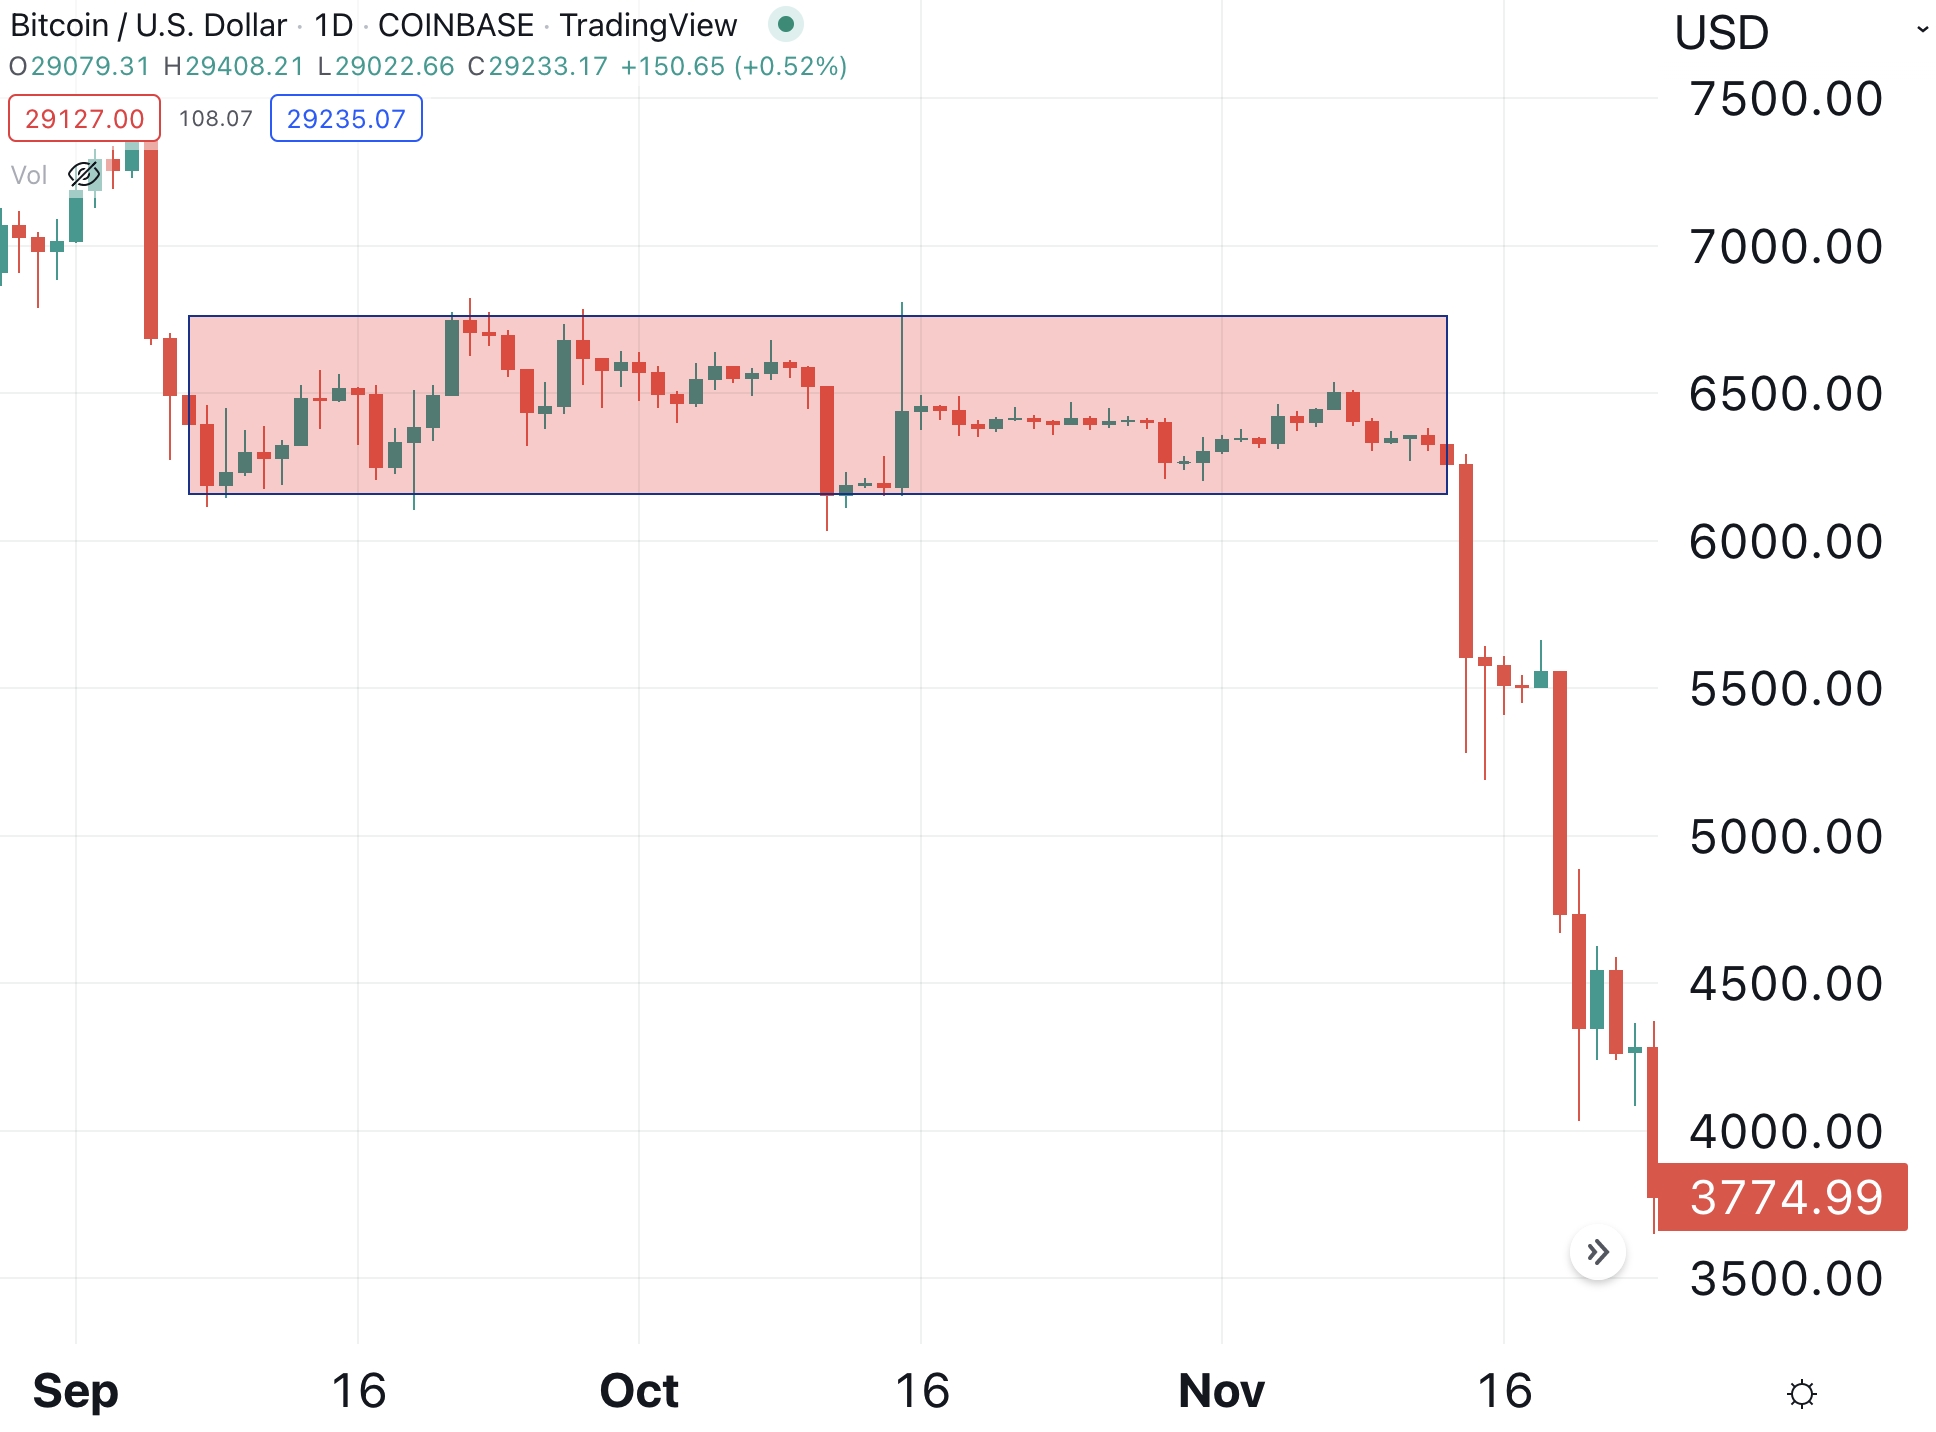
Similarly, BTC was also famously stable in October and November of 2018, towards the end of the infamous 2018 bitcoin bear market. Those who were around at the time may even remember how crypto traders were jokingly referring to BTC as the new “stablecoin.”

As the above meme suggests, however, the remarkable stability ended in a brutal fashion on November 14, when the final flush-out of the bear market sent BTC from around USD 6,400 to just USD 3,200 over the course of 30 days.
Bitcoin consolidation between September and November 2018:
Bitcoin’s most recent consolidation phases
Keeping in mind the brutal way in which the consolidation in September, October, and November 2018 ended for BTC, let’s now take a look at the 5 most recent bitcoin consolidations to see what lessons they can teach us.
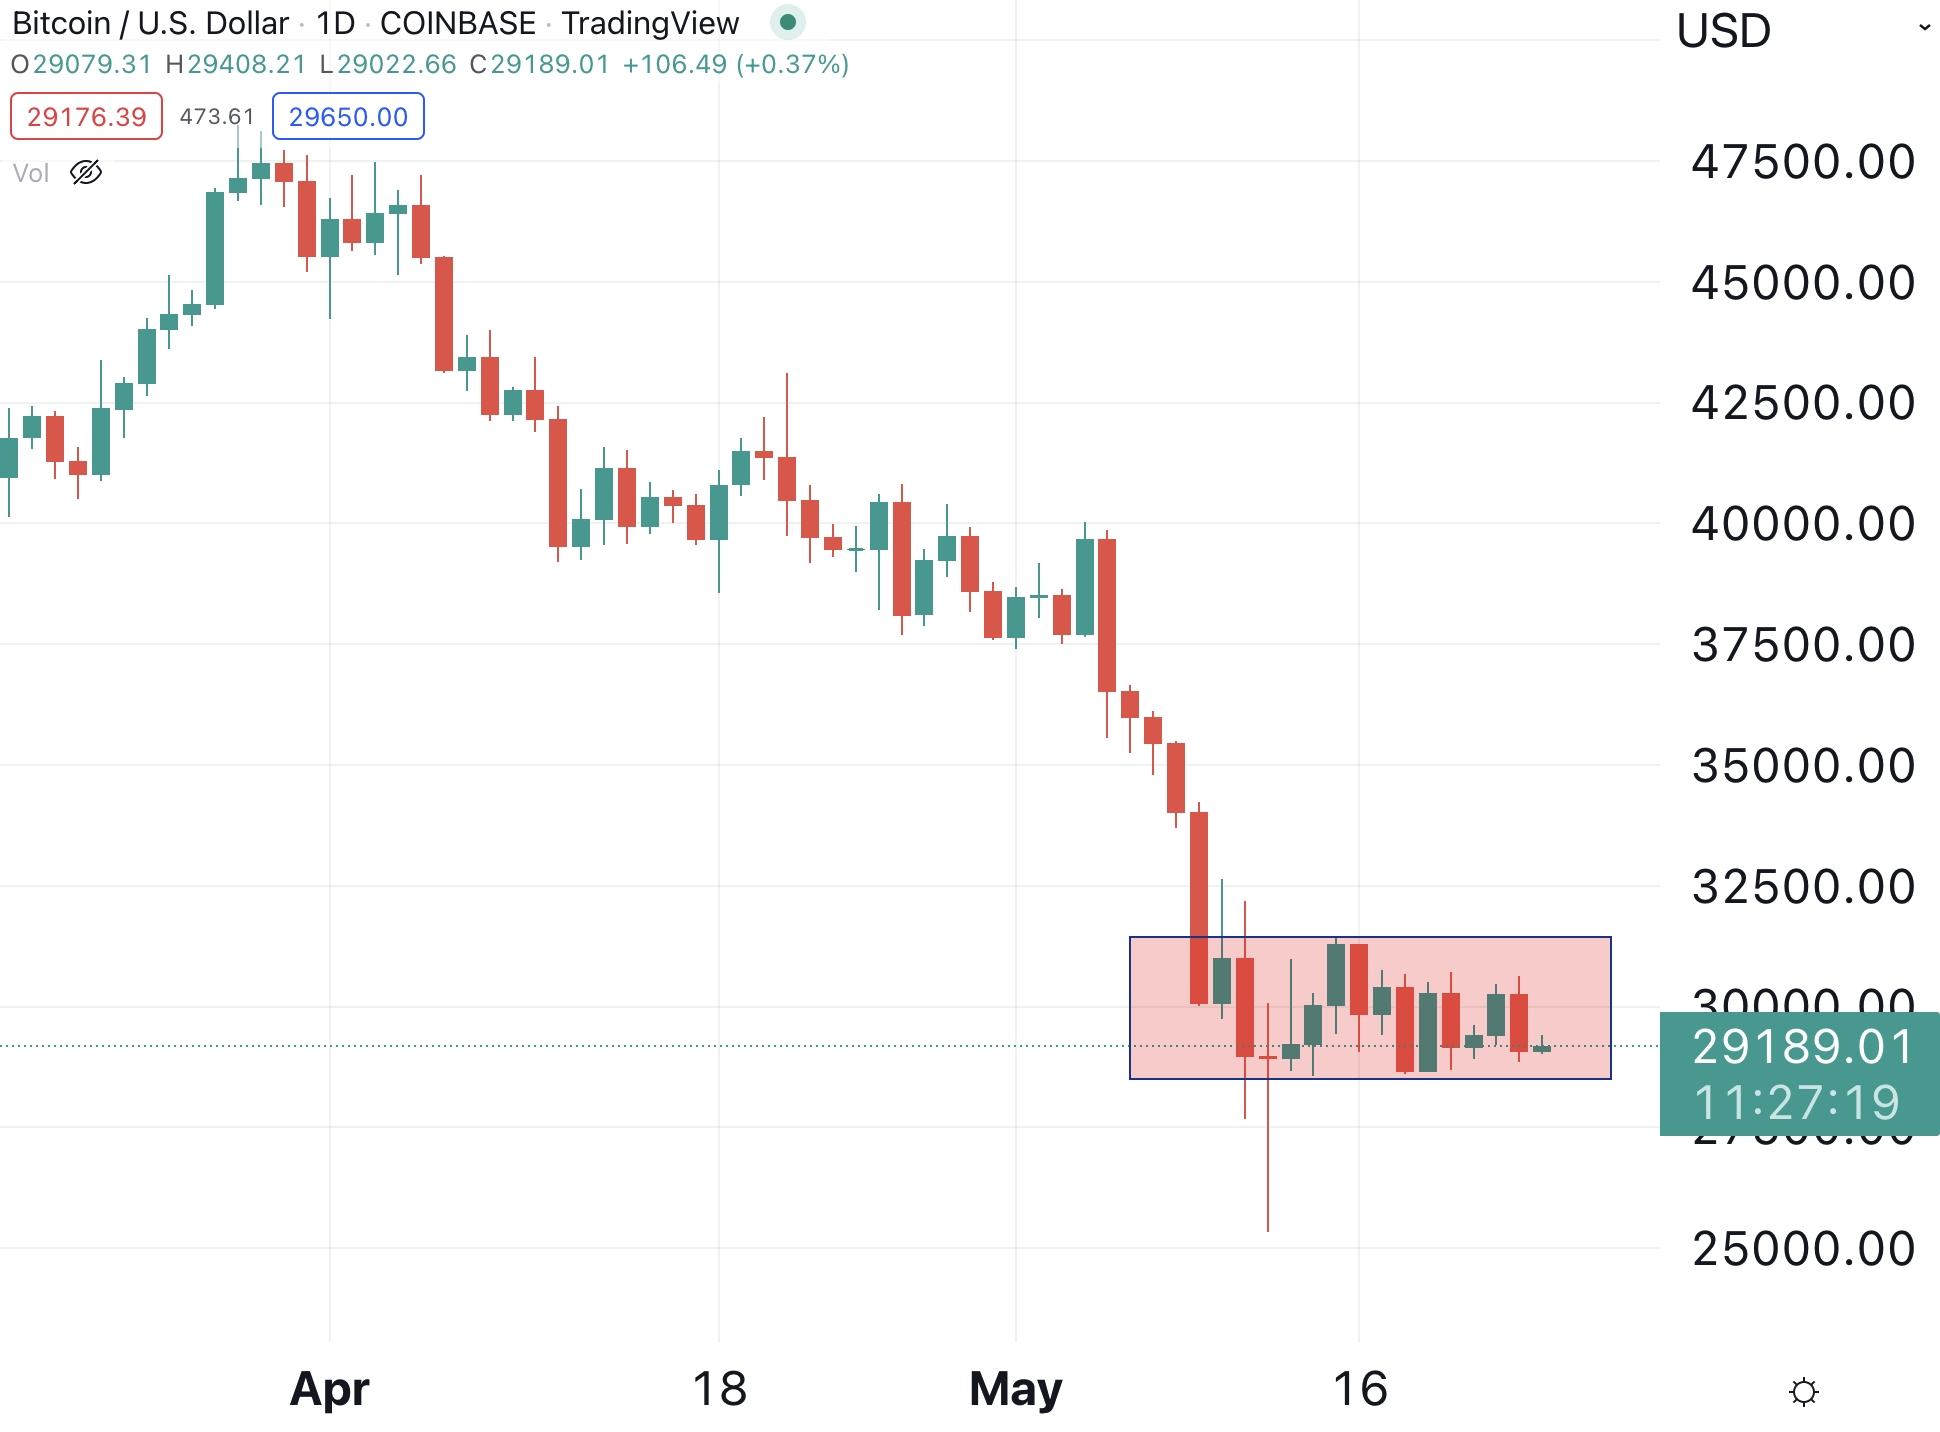
During the current consolidation phase, all of bitcoin’s daily candles have closed in the range between USD 28,700 and USD 31,300, with this phase so far lasting for more than two weeks. This consolidation has yet to end, and we, therefore, do not know if the break-out will come to the upside or the downside.
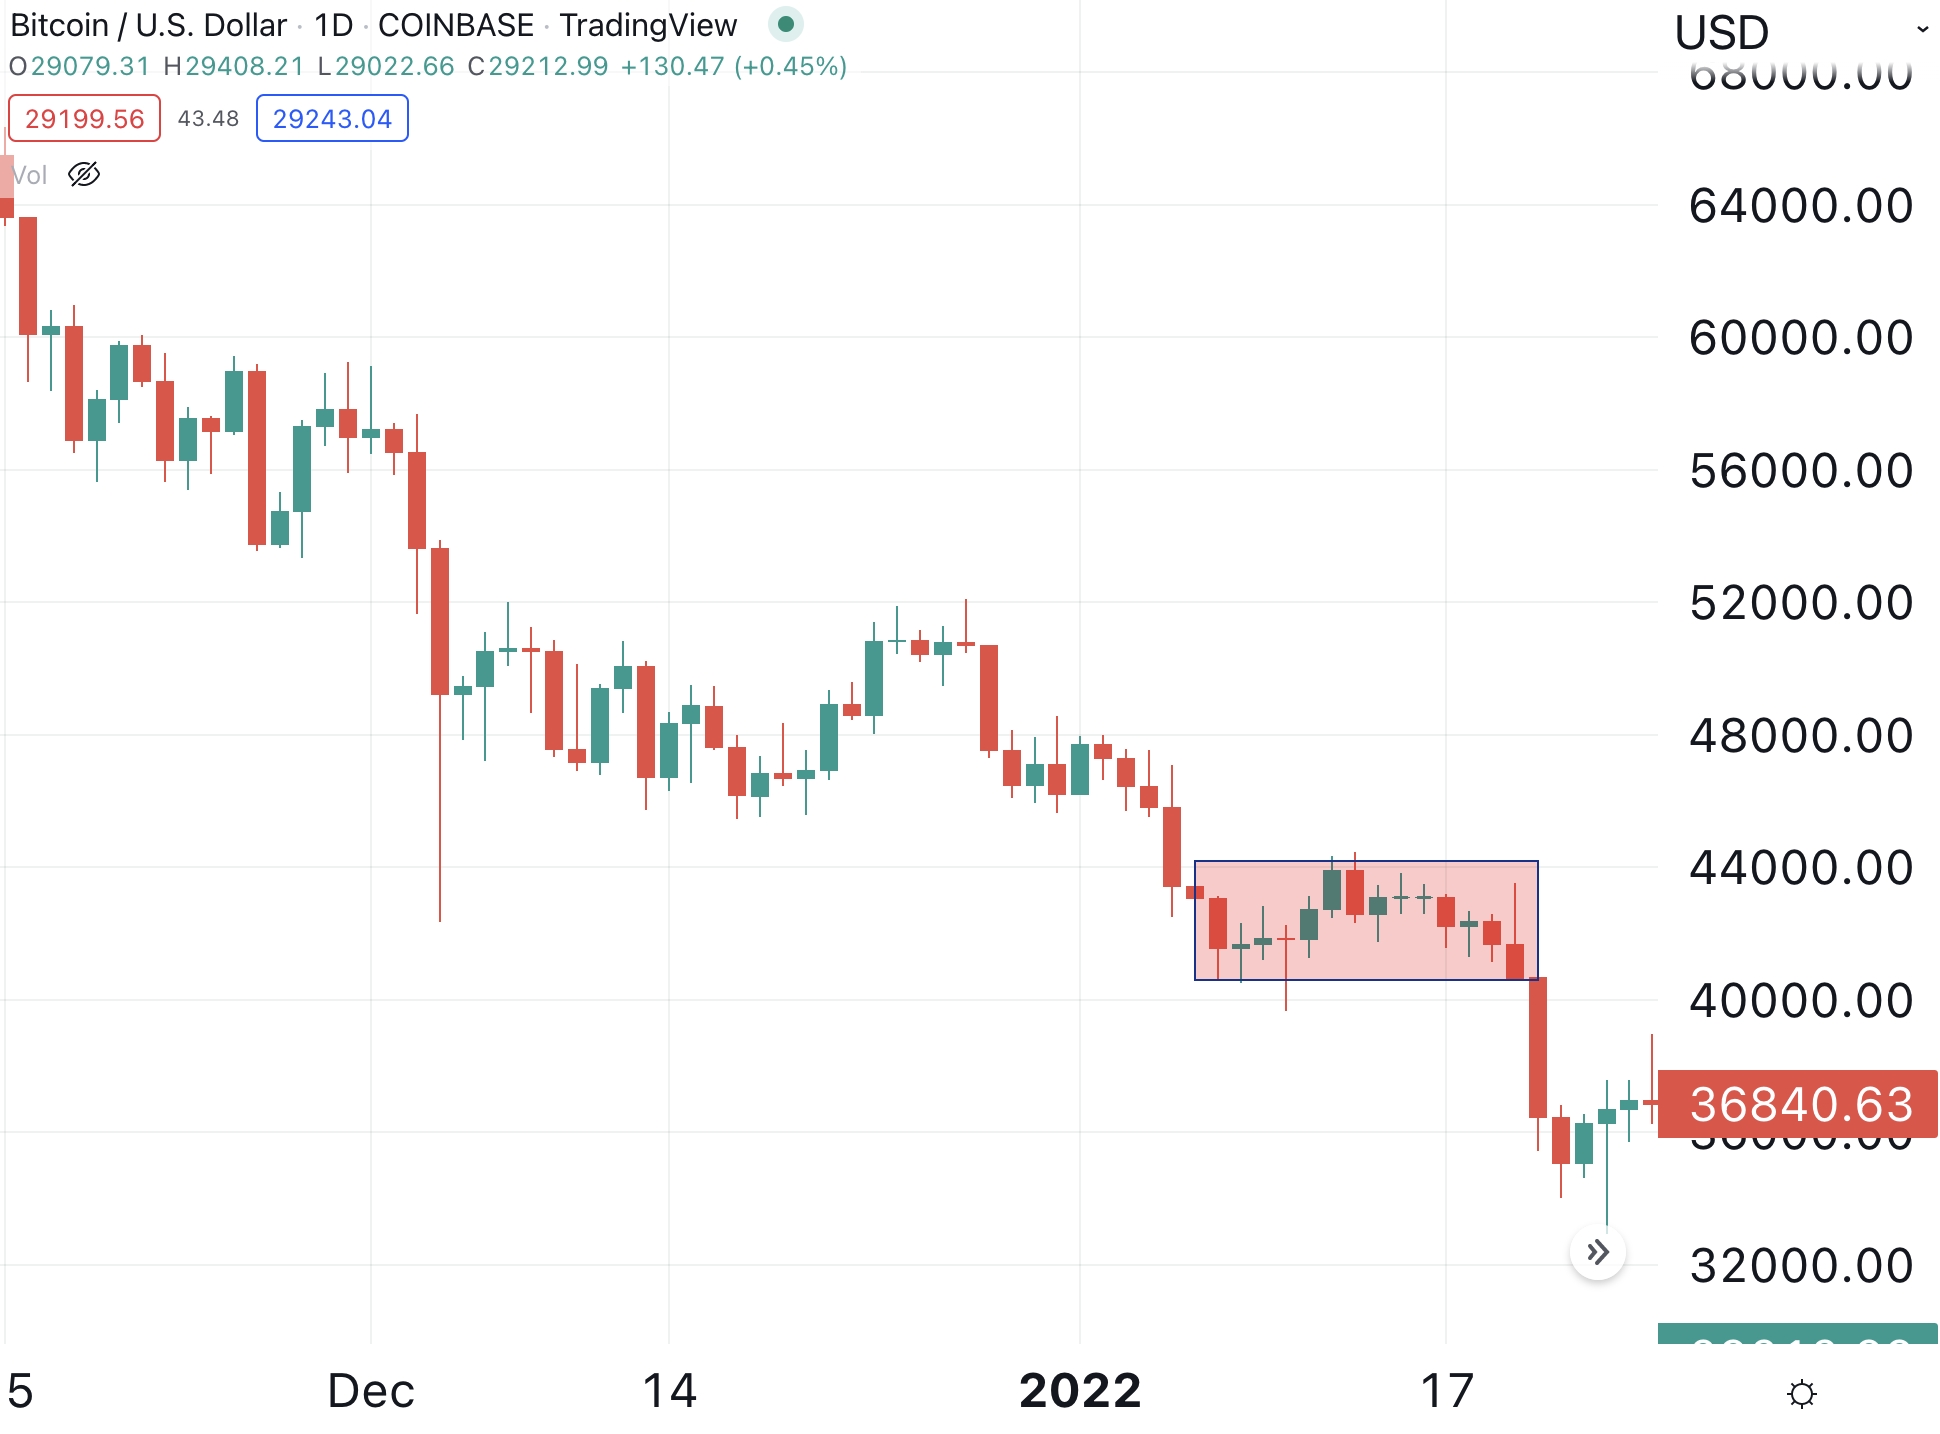
A similar consolidation phase was seen as recently as in January this year, when BTC stayed between USD 40,600 and USD 44,000 for 14 days. As with the current consolidation, the price this time around also stayed within a range that was roughly 10% from bottom to top.
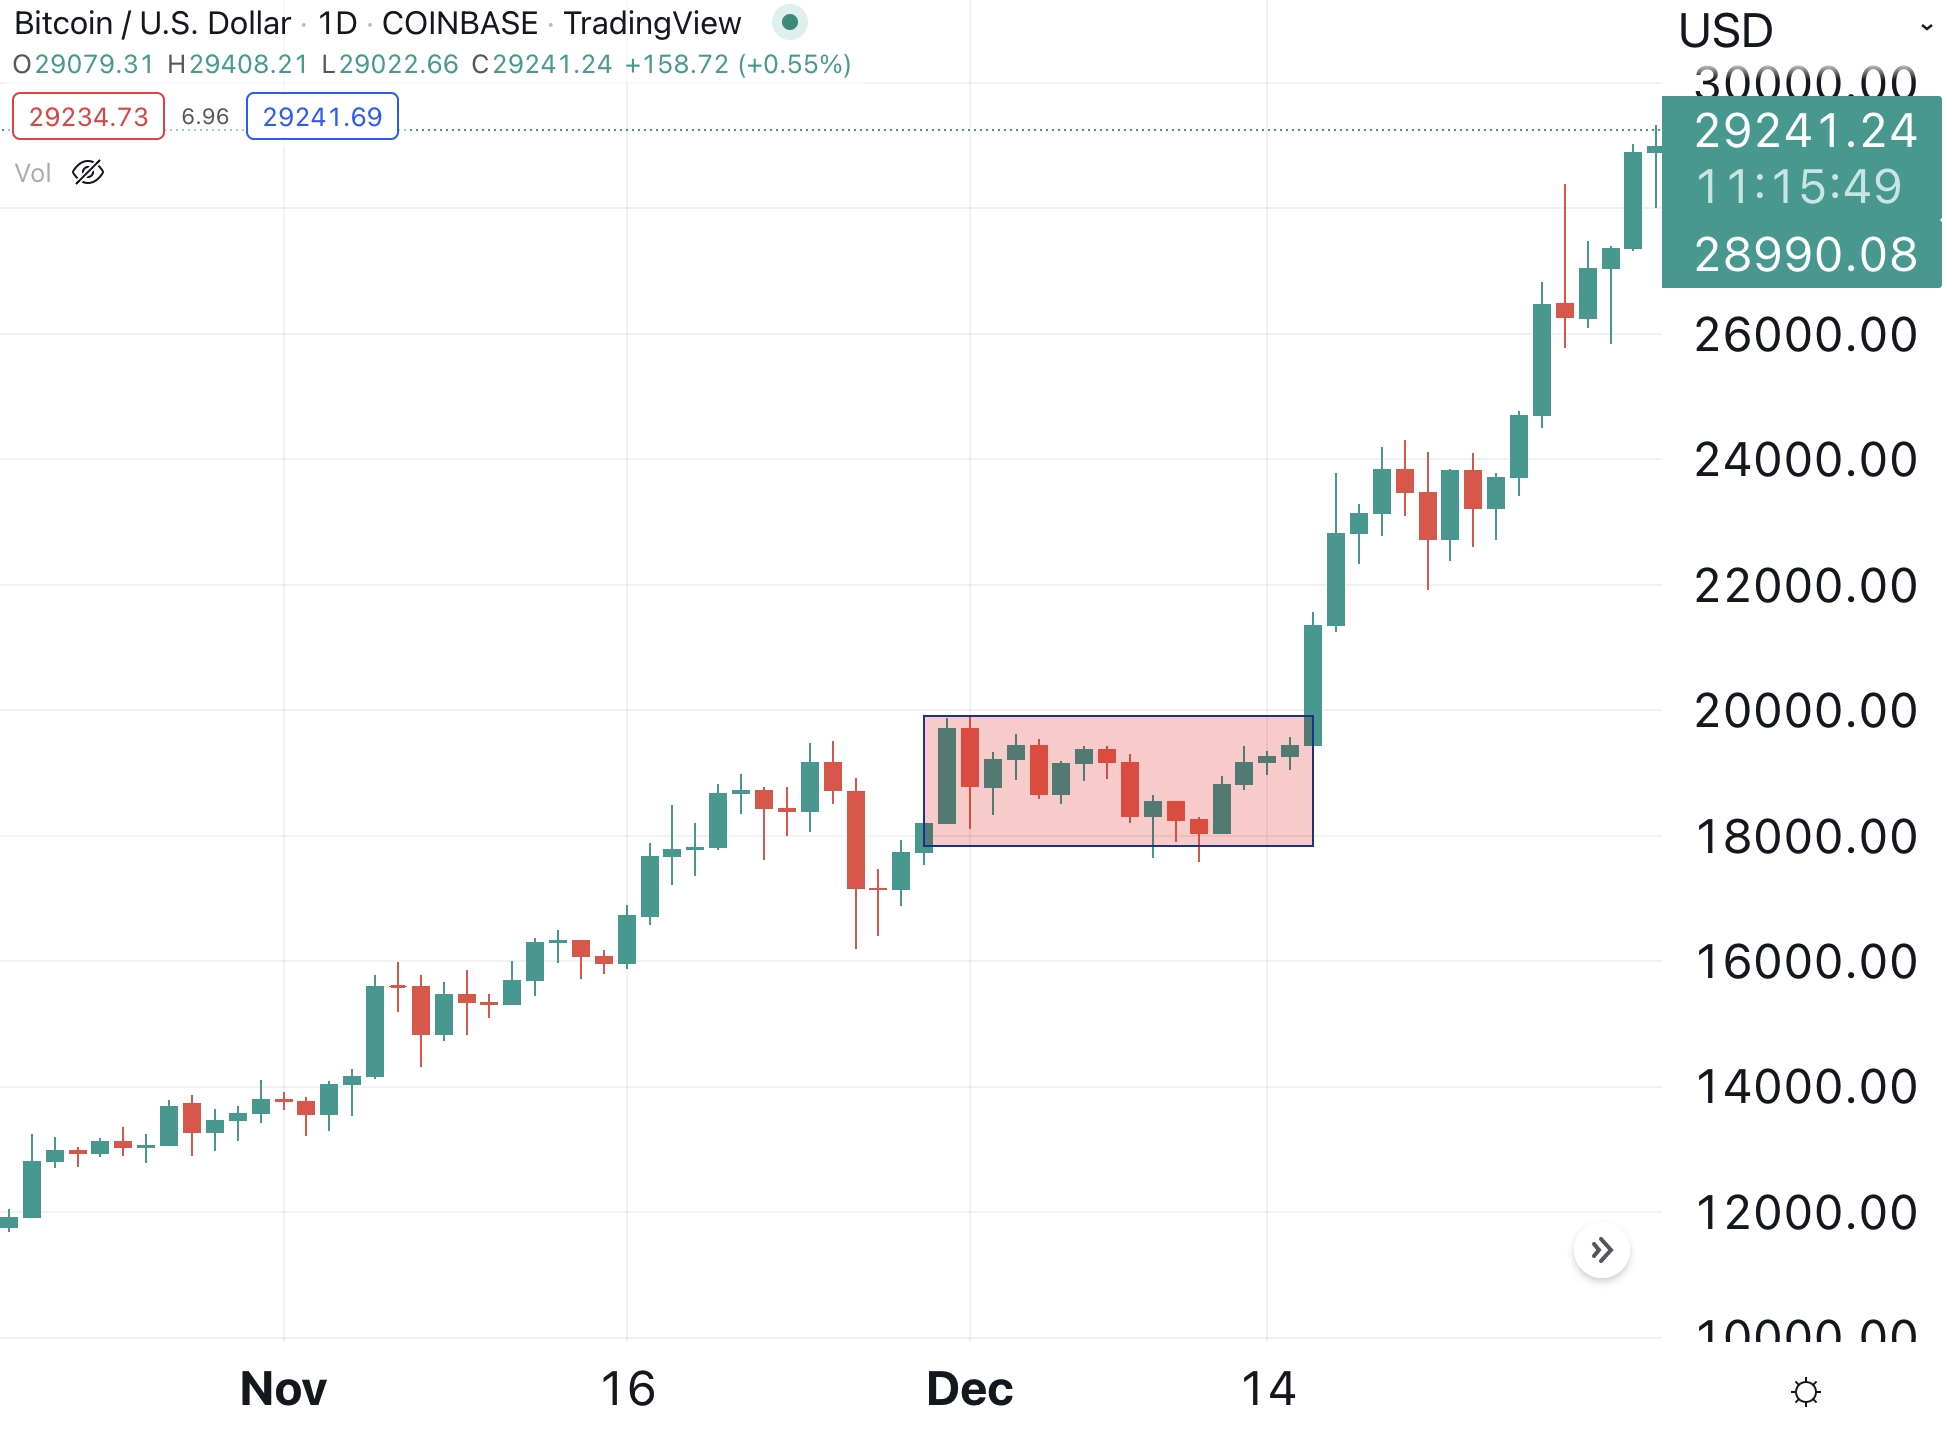
Another and even longer narrow consolidation phase was seen in December of 2020, when BTC spent 15 days inside the range between USD 18,000 and USD 19,700. The phase ended with a break-out higher, ultimately bringing BTC to a peak of over USD 60,000 in April the following year.
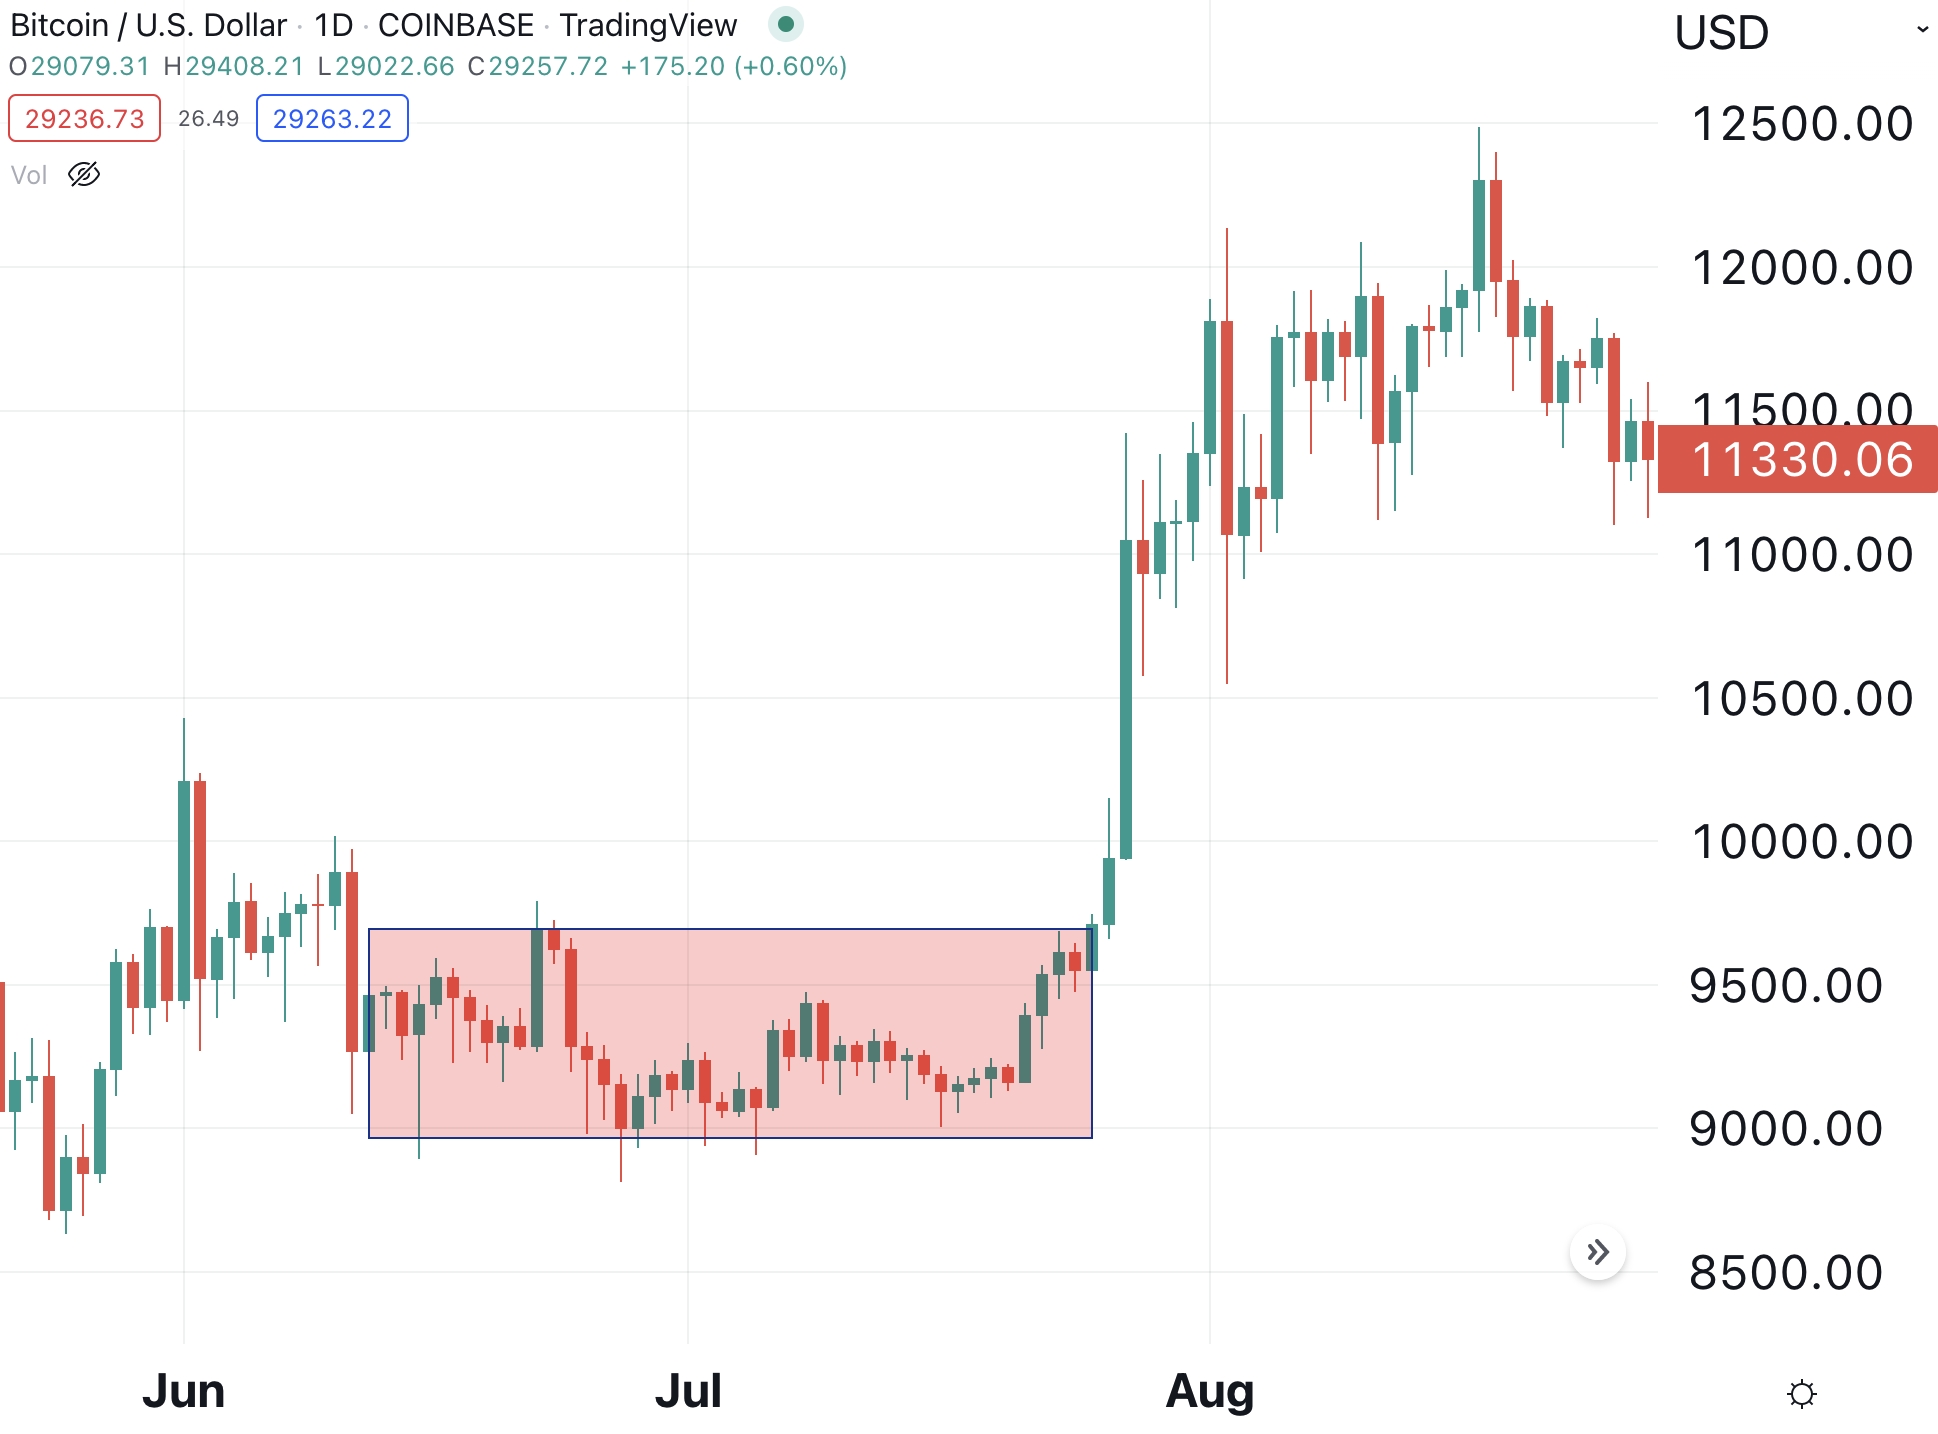
An even larger consolidation phase occurred in June and July 2020, when BTC stayed in the range between USD 9,000 and USD 9,700 for 42 days. Once again, the consolidation phase ended with a breakout to the upside, marking a continuation of the major bitcoin rally in late 2020.
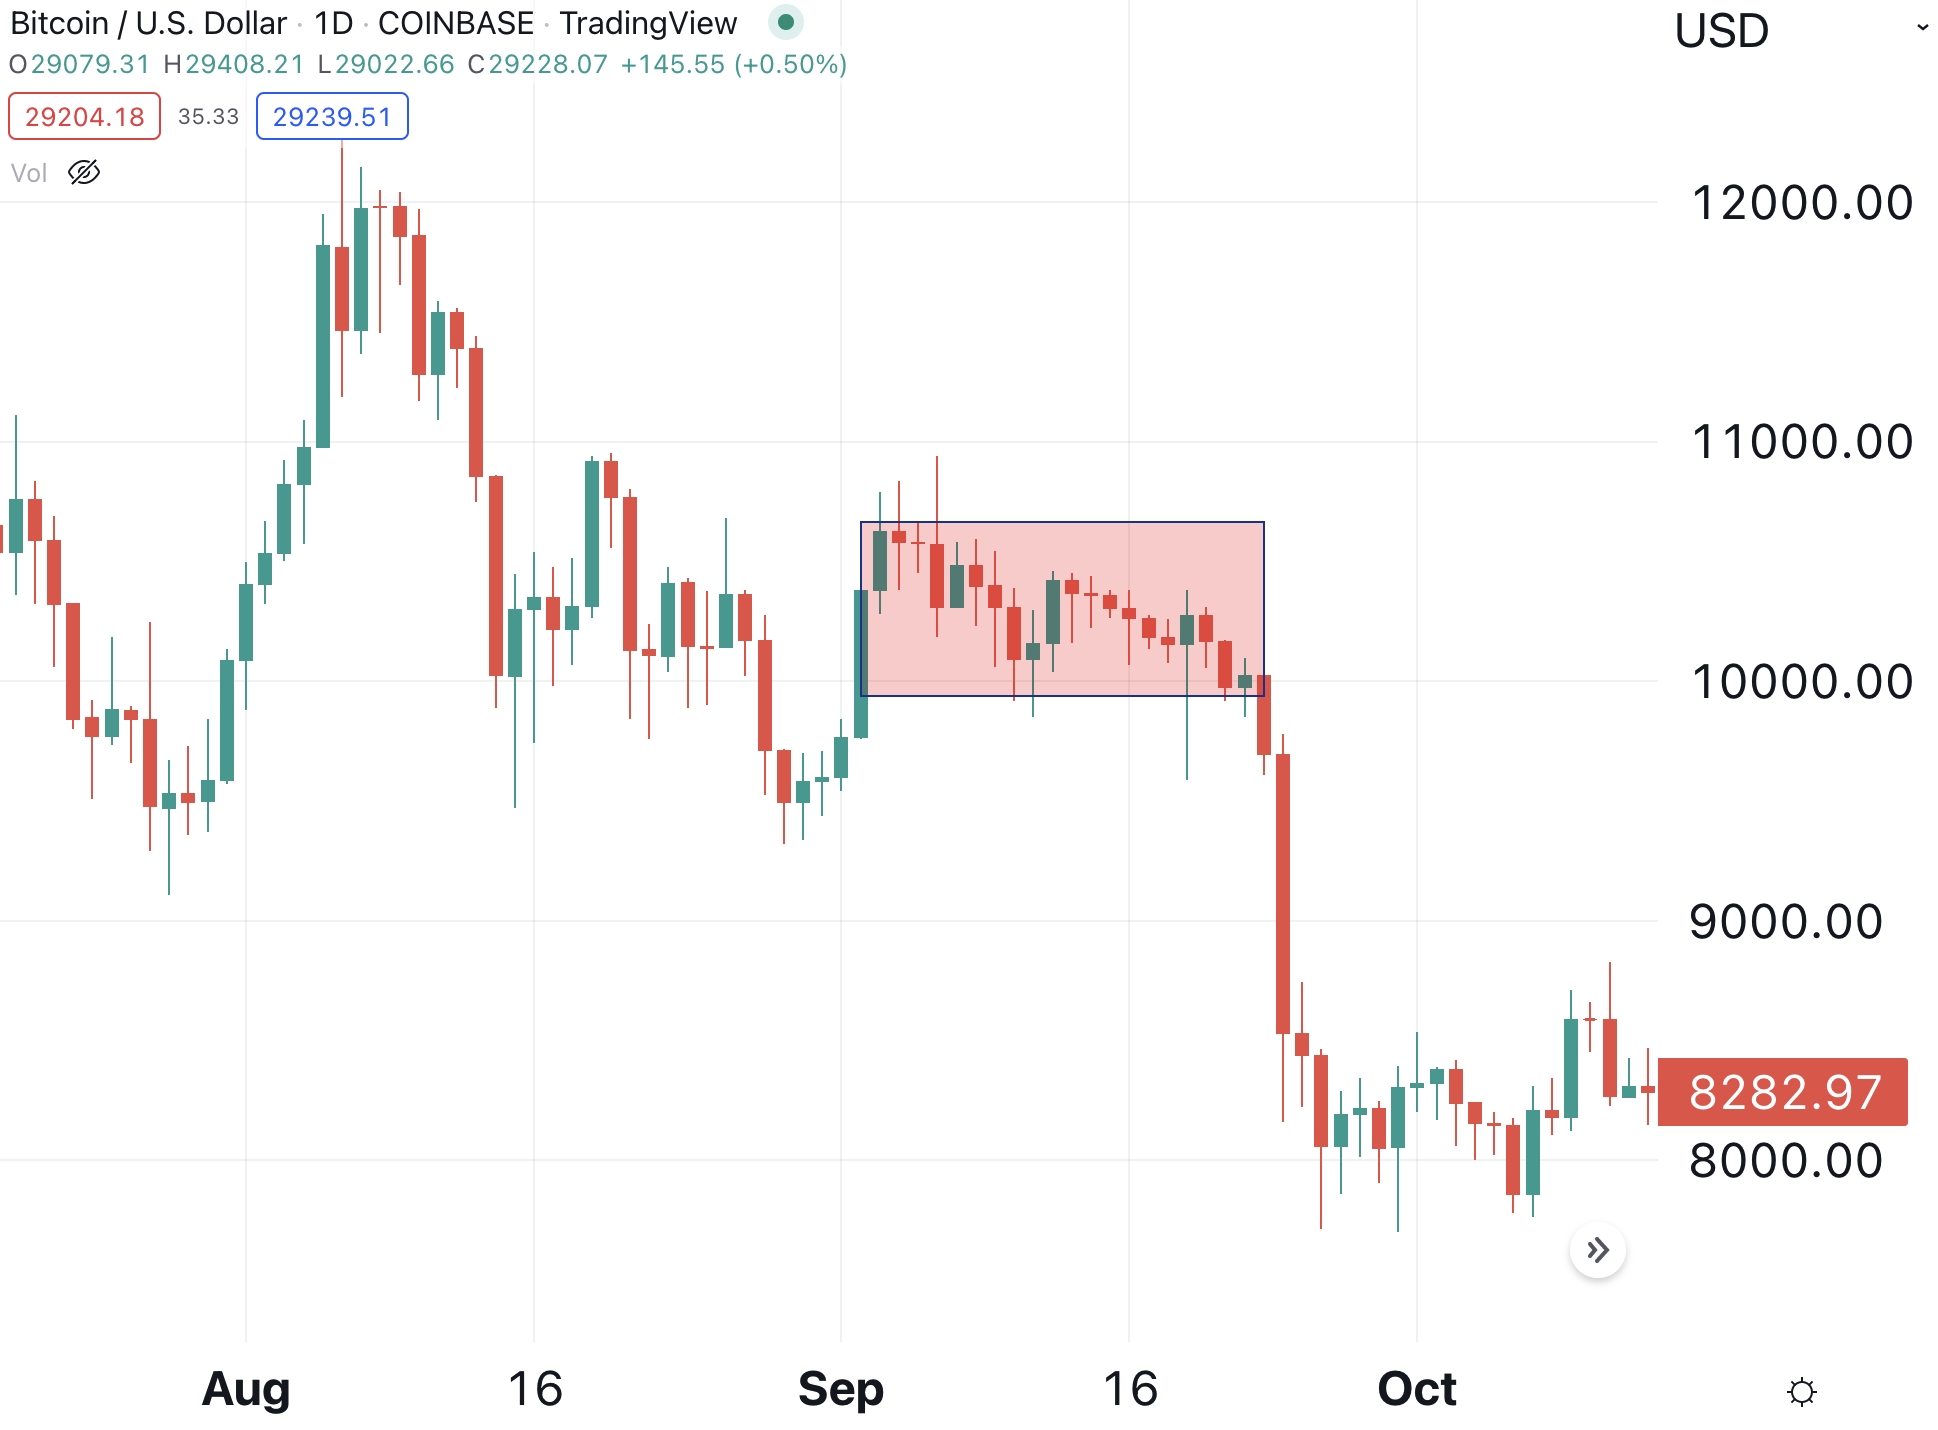
Lastly, going back to September of 2019, BTC stayed in the range between USD 9,900 and USD 10,600 for 19 days. This time, the consolidation ended with a break to the downside, which sent BTC about 15% lower over just 2 days.
More volatility ahead
To summarize, it’s not a new thing for bitcoin to trade within a relatively narrow range for weeks at a time, and often for two weeks or more.
These were only five of the most recent consolidation phases, and although we could have gone much further, the lesson to be learned remains the same: Consolidation phases always come to an end at some point, and this ending tends to come as a sharp spike in volatility – either to the downside of the upside.
For the sake of all the HODLers out there, we can only hope that this time it will be a break-out to the upside.

Source:cryptonews.com

